CoachView
A platform-friendly performance dashboard built to help coaches and sports scientists turn data into action. The live dashboard can be found at coachview.burkeopp.com
UI/UX
·
Product Design
·
Brand/Identity
Problem: Elite teams rely on performance data to make decisions, but existing tools often prioritize depth over usability — limiting real-time decision-making.
Audience: Coaches, trainers, and sports scientists who need quick, high-level insights from large datasets during and after training sessions.
Goal: To design an intuitive, responsive dashboard that visualizes athlete performance data in a way that’s immediately actionable.

Competitor Analysis
I conducted a competitive audit of leading sports performance platforms, including Catapult Vector, Whoop, and Polar Team Pro. Most tools offered robust data collection, but their dashboards were often dense and data-heavy, requiring significant interpretation. There was a gap in delivering quick-glance insights with mobile-first usability — especially for environments like sidelines or training fields. CoachView was designed to bridge that gap, focusing on clarity, interactivity, and adaptability.

Key Insights
Research findings revealed:
76% of coaches prefer visual dashboards over tables when reviewing athlete performance.
63% said they wanted easier filtering by position or team groupings.
81% reported using mobile devices on the field, but found many platforms weren't optimized for mobile use.
Based on my research, I created two personas. Dana, a head coach who needs a quick, high-level view of team performance and Jordan, a competitive runner who needs detailed individual data. Their overlapping needs emphasized rapid filtering by team, position, or player, Clear trends over time, and Minimal distractions on mobile or wearable screens.

User Flow
I designed the user flow to support fast, repeatable actions — ideal for in-the-moment decisions during training sessions or games. The experience was built around three core actions:
• Select a Team or Position Group
• Users can quickly filter the dashboard by team or athlete group using a sticky dropdown menu, visible at all screen sizes.
• Scan Athlete Cards
Each card surfaces key data points (heart rate, fatigue, top speed, training load) in a compact format. Color coding highlights performance outliers. Clicking on an athlete brings up a detailed view with time-based charts and performance history using Chart.js. These charts help coaches spot trends or fatigue over time. This linear-but-flexible structure ensures users can jump in at any step — ideal for unpredictable real-world use cases like mid-game adjustments or post-practice reviews.

I started with sketches and low-fidelity wireframes to explore layout options. I prioritized hierarchy, glanceability, and minimal tap targets for mobile use. Here’s a snapshot of early iterations:

Final Iterations
After refining components and microinteractions, I implemented a working prototype using React and Tailwind CSS. I used Chart.js to render responsive line and bar charts for key metrics. I also incorporated AI-powered design tools to streamline visual ideation and component styling.
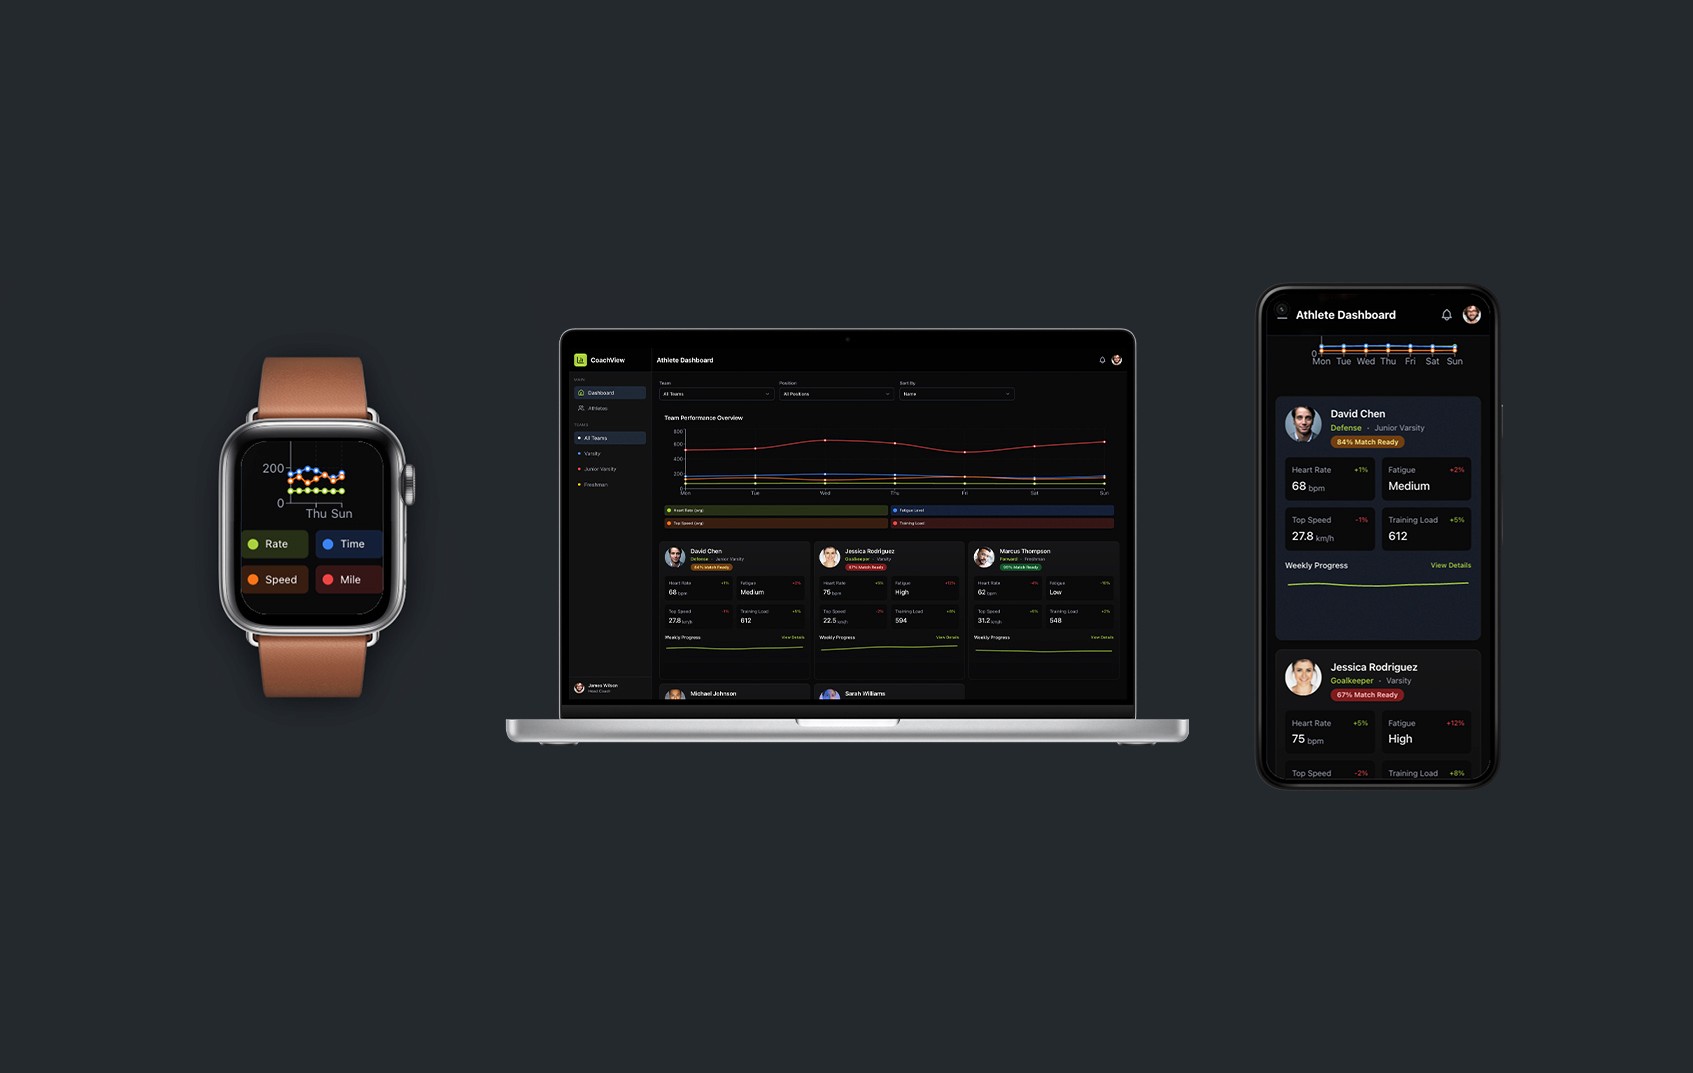
The app supports:
• Filtering by team, position, and player
• Real-time metric updates
• Functional on tablets, phones, and wearable devices

Outcome
CoachView demonstrates my ability to design and build accessible, data-rich tools that empower performance-driven teams. This project reflects my strengths in UX design, front-end development, and thoughtful data visualization — all aligned with Catapult Sports' mission to push human performance forward.
View live prototype: coachview.burkeopp.com

